
Cartography and Geospatial Web Design
Geospatial Professional Network - Vanguard Cabinet Website


Client: New Light Technologies
Project: implement a recent hurricane risk forecasting and web GIS application using the Felt API and web UI and evaluate development experience and user experience against current deployment.
Results: NLT FELT Subscription for geospatial employees.
Year: 2025

Community Characteristics of Commerce Investments


Client: US Census Commerce of Economy 2024
Project: Community Characteristics of Commerce Investments
Purpose: The application allows users to:
Explore various measures to understand community (county) characteristics better.
Identify counties participating in a federally-funded program and view the characteristics of these counties and the attributes of non-participating counties (either the rest of the nation or a user-curated list of "eligible" counties).
View differences in groups of participating and non-participating counties over time, and overlay program start and end year onto the time series.
Role: Design the UI / UX component and determine data variables for Economic Health Reort
Geospatial Professional Network - Vanguard Cabinet Website
Client: Geospatial Professional Network
Project: Vanguard Cabinet’s First Website for Young Geospatial Professionals.
Year: 2025


Business Economic Analysis Dashboard for Economic Impact
Client: FEMA, National Business Emergency Operation Center
Year: Jan 2023 - 2024
Role: Business dataset evaluation and comparison, dashboard front-end design, database and feature service creation and maintenance, Big Data Solutions research, data conflation to FEMA models, and curated damage assessment. Implementing economic impact indexes.
Action:
* BEAD was selected to be showcased on the ESRI UC 2024 Plenary Session for Disasters
Understanding the business and economic environment during normal operations
Providing event characterization, consequence analysis, and decision support during response
Rapidly assessing the economic environment and expediting the stabilization of lifelines, supply chains, and business operations during the response
Identifying performance indicators to measure response operations effectiveness and identify critical shortfalls that require risk planning and action
Supporting coordination with Recovery Support Functions and informing business and economic assessments during recovery


Audience: FEMA Recovery Sector. The Business and Economic Analysis Dashboards (BEAD) provide access to open-source and commercial business data, visualize economic insights and trends, and support the development of reports during normal operations, response, and recovery.

Global Disaster Risk and Resilient Program - World Bank


City Resilient Program
Audience: The team worked with the World Bank’s Global Facility for Disaster-Resistant and Recovery - City Resilience Program (CRP), and Open Cities Africa, on resilience planning and capital mobilization for Africa. The CRP's extensive technical support ecosystem integrates climate and catastrophe risk scenarios into cities' upstream planning using the World Bank Group's sectoral expertise. The CRP's approach shifts from sectoral priorities to integrated and spatially informed priorities that capture the natural and built environments, transforming how cities can be supported to address their most pressing development challenges.
Role: Data Integration and ESRI Suite Architecture Design. Setting up GDFRR World Bank Enterpise and Portal AGOL to a shell for the 30 African city geospatial data, survey tools, and disaster risk web maps. The risk stories for each city lived with its its own unique story map that captured graphic, images, text, and cartography products that capture the city unique cultural features and history of disasters. these story maps then organized on to single landing ArcGIS Hub page.
Action:
Mapped critical infrastructure, built environment, and natural hazards across nine African cities.
Trained local stakeholders in data collection, mapping, and risk information usage.
Developed flood hazard maps in Yaoundé to inform urban and land use planning.
Fostered cross-city knowledge sharing and mentoring between technical teams.
Improved risk data storage and accessibility strategies through partnerships with EU and World Bank teams.
Helped establish a foundation for an urban transit observatory and integrated disaster resilience into city investment planning.
Created collaborative, sustainable networks for continued disaster risk reduction and urban resilience building.
Client
World Bank , GFDRR CityCORE Africa Initiative, Open City Africa
Year
08/2020 - 03/2021


Community Lifeline Dashboards
Audience: Developed as a Framework to increase effectiveness during disaster operations and response. The dashboards were designed to monitor critical infastruce to understand the location and intensity of impacts of all incidents for the nation and understand when critical infastructure has been brought on line its reached stabalization. Monitor the operational status of the lifelines, offline to stable, by appropriate and grouped lifeline category, to facilitate the situational awareness of FEMA’s National Response Coordination Center (NRCC) during steady and activation states. Community Lifeline Monitoring Dashboards assist in the above to visualize Facilitate the situational awareness of FEMA’s National Response Coordination Center (NRCC) during steady and activation states. these feeds are incorporated into other predictve risk and exposure models
Role: Identify the real time datsets for dashboards to ingest. Set up Cloud managment system: GeoEvent Servier and Velocity to ingest live feeds, transform into feature services, and archive in AWS databases to be shared to federal agency partners and store as sources that can be used to validate predictive risk models.
Client
FEMA
Year
02/2019
-
![]()
Health Lifeline
Datasets from EPA's Facility Registry System (FRS), Superfund Sites, Nuclear facilities, Solid Waste Landfills, and Biological Processing Facilities. Hazardous Material Routes, petroleum ports, and gas pipelines are also included.
-
![]()
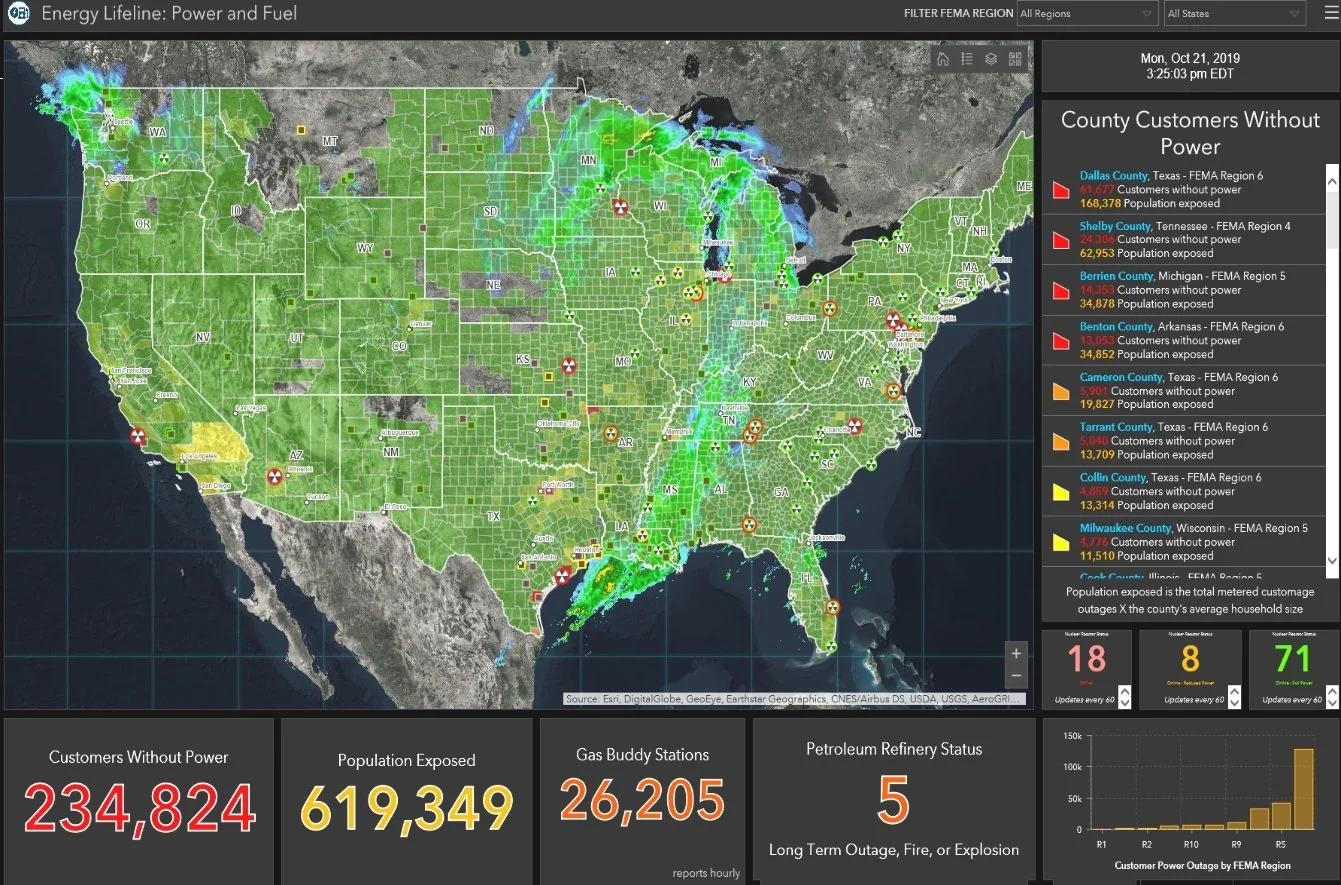
Energy Lifeline
Energy Lifeline Dashboard for Power & Fuel. Must be on the FEMA internal network in order to view this dashboard.
-
![]()
Communication Lifeline
FCC's Disaster Information Reporting System (DIRS) data is used to visualize and report cell tower outages, Public Safety Access Points (PSAP), AM transmission towers, and Microwave Service Towers aggregated to the county level.
-
![]()
Transportation Lifeline
It all begins with an idea. Maybe you want to launch a business. Maybe you want to turn a hobby into something more.
-
![]()
Security Lifeline
Publicly viewable operations showing the spatial distribution of waypoints collected by FEMA Urban Search & Rescue (US&R) Task Forces. National Flood Insurance Program (NFIP) , and Wild fire (USGS GeoMAC) data are included.i
-
![]()
Hazards Lifeline
Datasets from EPA's Facility Registry System (FRS), Superfund Sites, Nuclear facilities, Solid Waste Landfills, and Biological Processing Facilities. Hazardous Material Routes, petroleum ports, and gas pipelines are also included.


Exploring Rotterdam Through an iPhone 7 - Geospatial World Forum 2023
Client: New Light Technologies
Purpose: Marketing content to capture my trip to the Geospatial World Forum Conference as well as an opportunity to play with ESRI Vector Basemap edit-style capabilities.
Software/Data: ESRI VEcotry Basebap Editor & OpenStreetMap, iPhone photos.
Year: May 2023
FEMA Regional Geospatial Incident Journals
Audience: FEMA's request for Incident Journals is designed to monitor unique incidents and provide the best data available to the public and FEMA staff to understand areas at most significant risk of incoming incidents and how to plan and prepare to stabilize.
Role: Geospatial engineer: Design, Data Ingestion, and Matience.

Client
FEMA Regional Geospatial Office
Year
2018 - 202


Digital Nautical Charts Conflation (NOAA)
Client: Leidos contract for The Navy
Year: 2015
Purpose: Prepped nautical conversation data at four scales to combine horizontally and vertically into a 101T (one database) to improve NOAA navigation safety. Excellent understanding of GDS marine business norms and laws.
The Data Reviewer performed QC/QA checks to ensure accuracy and maintain topological links.
Role: Cartographer, geospatial data clean up, QC/QA